
I was very interested in monitoring the surrounding air’s quality, so I built a box that monitors Particle Matters (PM), gas concentrations, temperature and humidity. The historical data is persisted and accessible via the network ? translating to a typical IOT use case.
The box built is based on Arduino with its sensors and a RaspberryPi.
Arduino is a great platform for electronics prototyping with a convenient development IDE ? it allows to connect sensors to the board and share the data via multiple interfaces (such as serial port, attached SD card, network, etc.).
The networking and data persistence are solved via a Raspberry Pi Zero W, providing SD-card based data plotting, having a host and guest Wifi network for data access and data sharing with cloud providers.
Specification
- Start measurement as soon as powered on ? if power is interrupted, have the ability to resume without user interactions
- Store historic measurements
- Be capable of logging in to an own SSID: AirQuality Wifi network to read sensor data
- Join preconfigured Wifi networks automatically
- Every 30 seconds, share the following data on the LCD screen
- Every 5 minutes, persist 10 records to the SD card /air/data.csv (to spare the SD Card?s longevity via batch jobs)
CSV format:
DD/MM/YYYY;HH:MM:SS;WindDeg;WindSpeed;Start_Time;PM_Ratio;PM_Conc.;MQ_Raw;Temperature;Humidity
| Field | Format | Source |
| Date | String, DD/MM/YYYY | RPI |
| Time | String, HH:MM:SS | RPI |
| Wind_Degrees | 3 char Stringe.g. NNW | RPI, Openweathermaps API |
| Wind_Speed | Float, mph | RPI, Openweathermaps API |
| Start_Time | Int, minutes passed | Arduino |
| PM_Ratio | Float, sensor reading of DSM501A | Arduino |
| PM_Concentration |
Based on the ration to PM ug/m3 curve of DSM501A | Arduino |
| MQ_Raw | Integer, based on the readier of MQ135 | Arduino |
| Temperature | Float, based on the readier of DHT22 | Arduino |
| Humidity | Float, based on the readier of DHT22 | Arduino |
Hardware
The costs were incredibly low – on the other hand, the efforts invested were rather on the high end.
All the parts were coming from Ebay / Aliexpress
| Hardware | Costs |
| Data collection | |
| Arduino Uno R3 | 4 $ |
| Raspberry Pi Zero W | 10 $ |
| 8 GB MicroSD card | 5 $ |
| Sensors | |
| DSM501A Dust Sensor | 5 $ |
| IIC/I2C 1602 LCD Display Module | 3 $ |
| DHT22 Temperature & humidity | 3 $ |
| MB102 3.3v, 5v solderless power module for 6 components | 1 $ |
| MQ135 Quality Sensor Hazardous Gas Detection Module For Arduino | 1.5 $ |
| Power, cables, misc | |
| Chocolate paperboard box | Found it in the drawer |
| Wiring Arduino components: Cable kit – 120pcs 10cm Male to Male + Female to Male + Female to Female Jumper Wire Dupont Cables, multiple color | 2 $ |
| Arduino to Raspberry comm. & power: USB-B male to USB male cable (printer cable) | 2 $ |
| Arduino to Raspberry comm. & power: Adapter: Micro USB male to USB female adapter to connect Rapsberry Pi Micro USB data port to Arduino via USB-B male to USB male cable | 1 $ |
| Powering Raspberry: Micro USB to USB male cable | 1 $ |
| Powering sensors: Mini USB male to USB male cable powering the MB102 power module via USB.
Alternatively a USB power boost line DC 5V to DC 9V / 12V Step UP Module USB Converter Adapter Cable 2.1×5.5mm Plug for would work as MB102 power module has a round 9-12V input port as well |
1 $ |
| Powering sensors: MB102 power module for powering an MB102 breadboard or 6 Arduino components | 1 $ |
| Charger: Blitzwolf 2 port, 2 * 2.4 A USB charger for powering the components | 5 $ |
| Sum | ~45 $ |
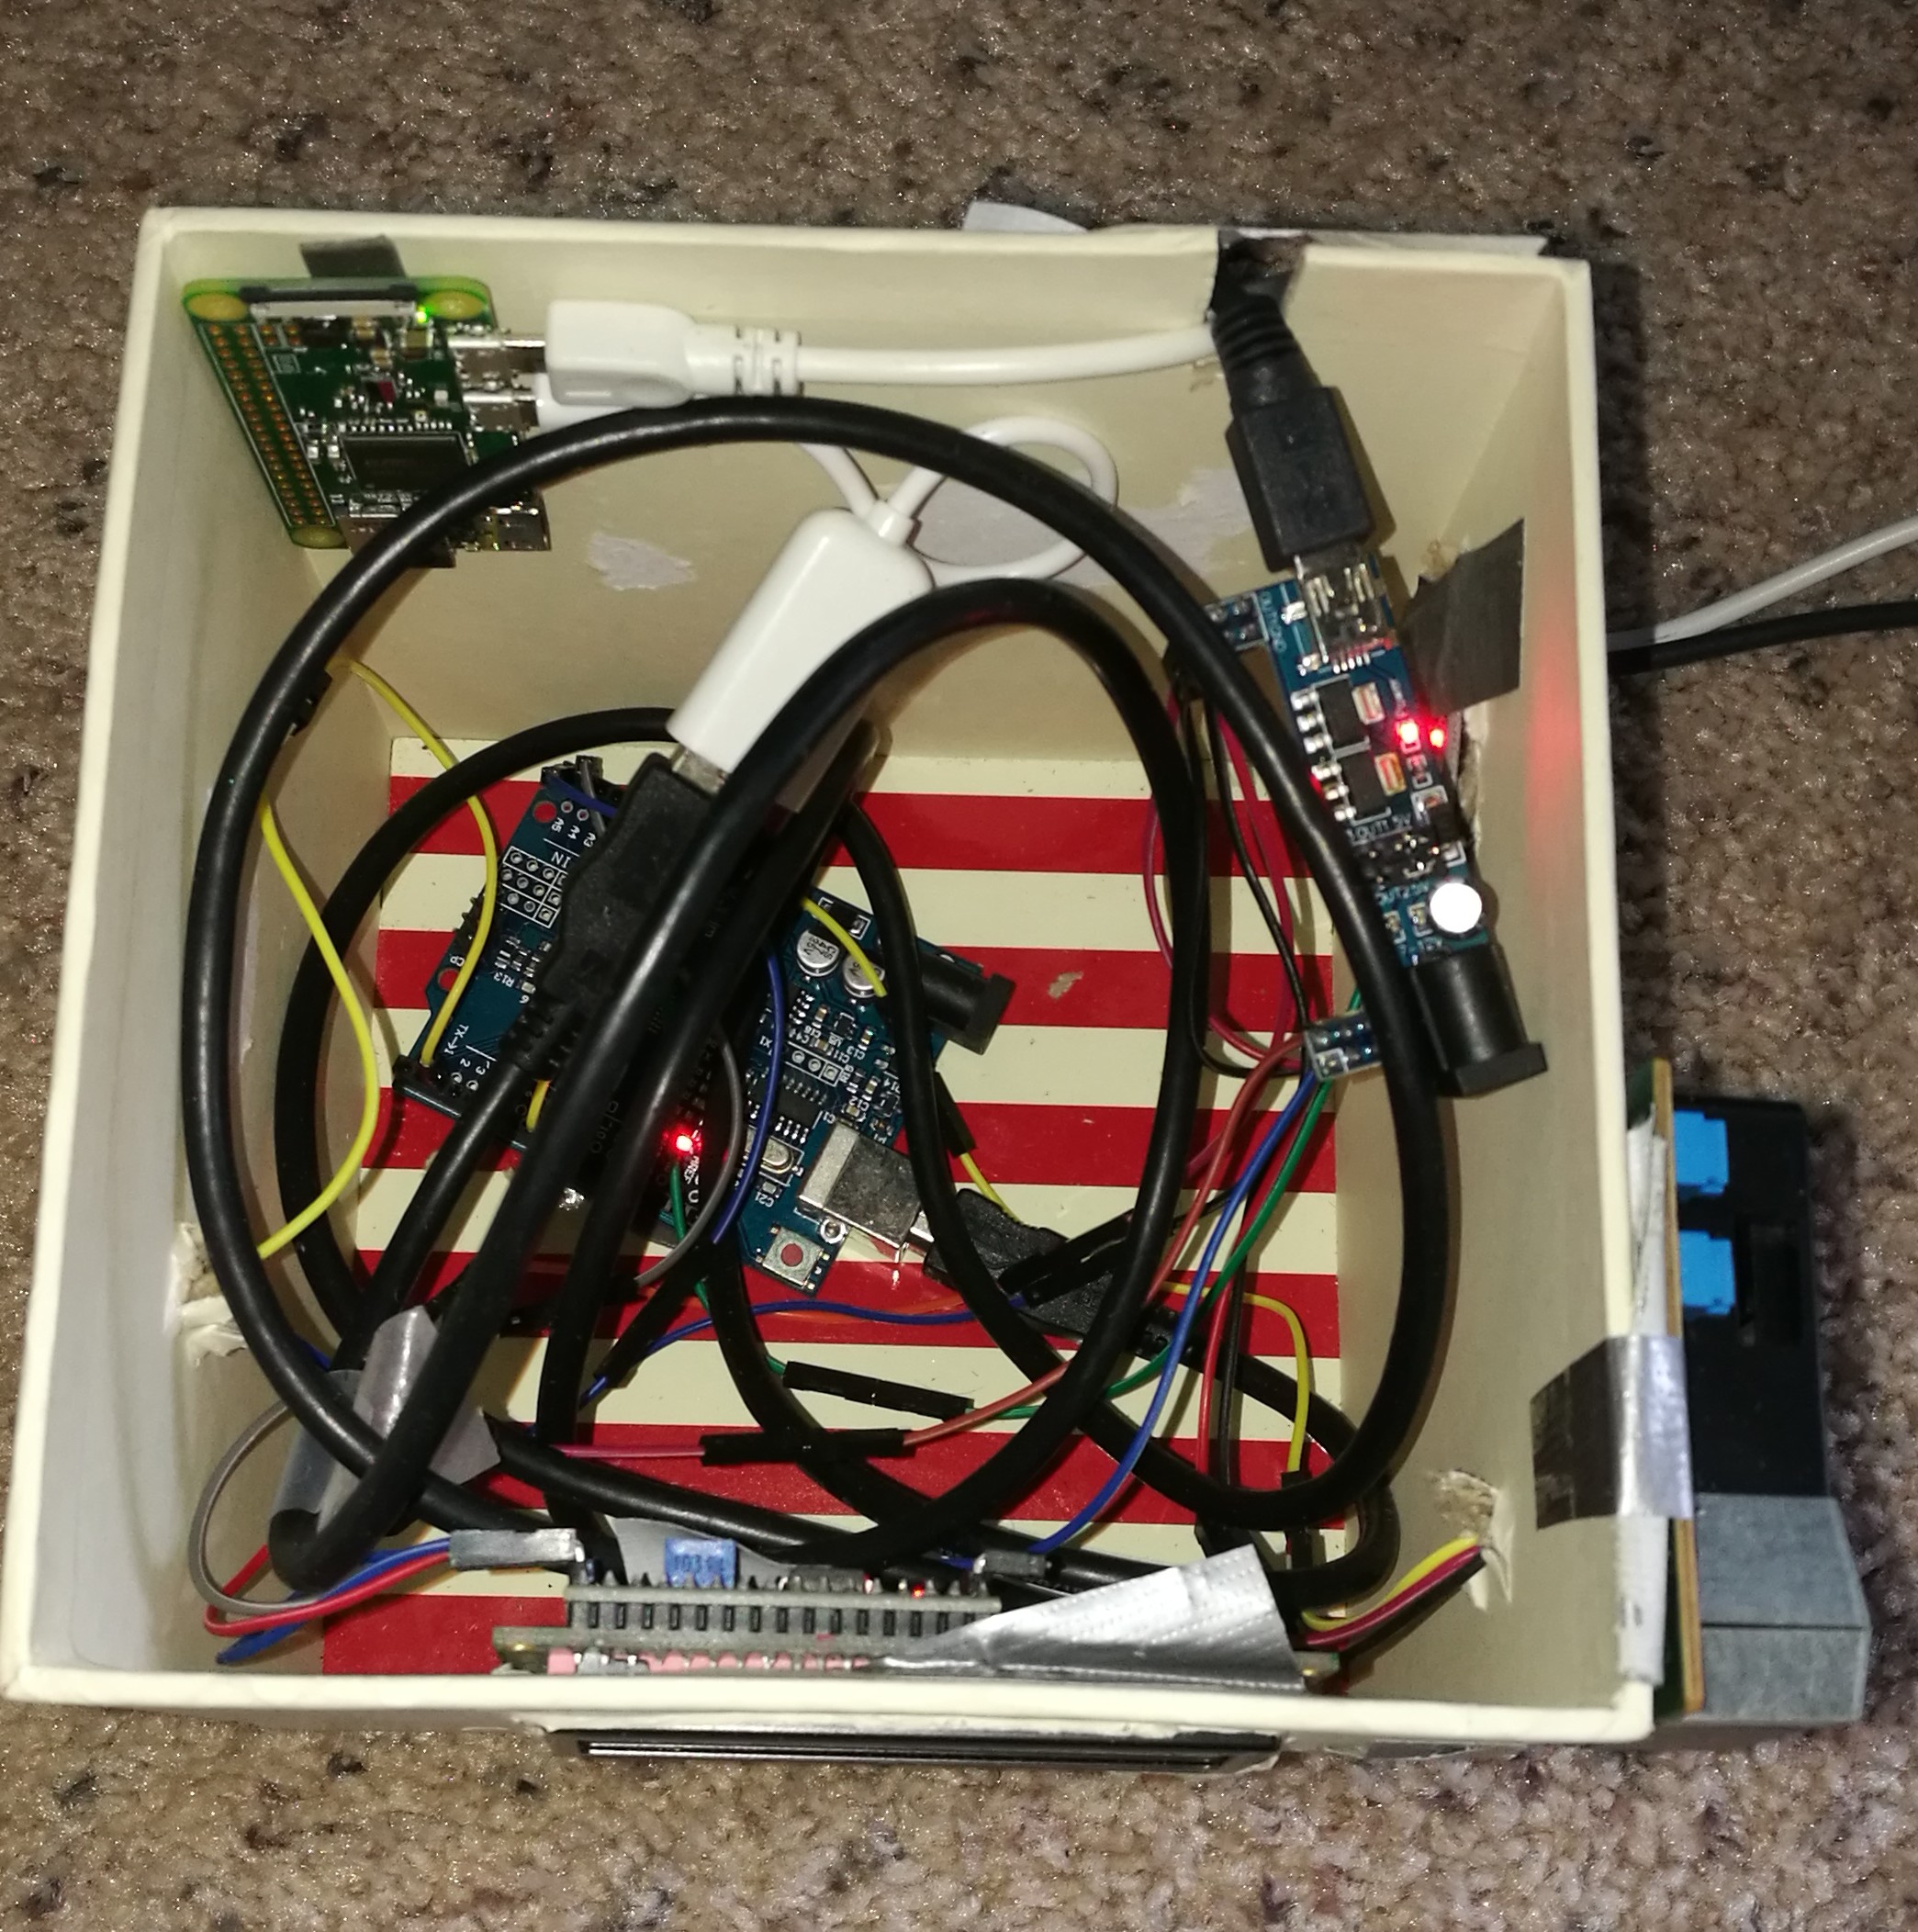
Air quality monitor hardware – I
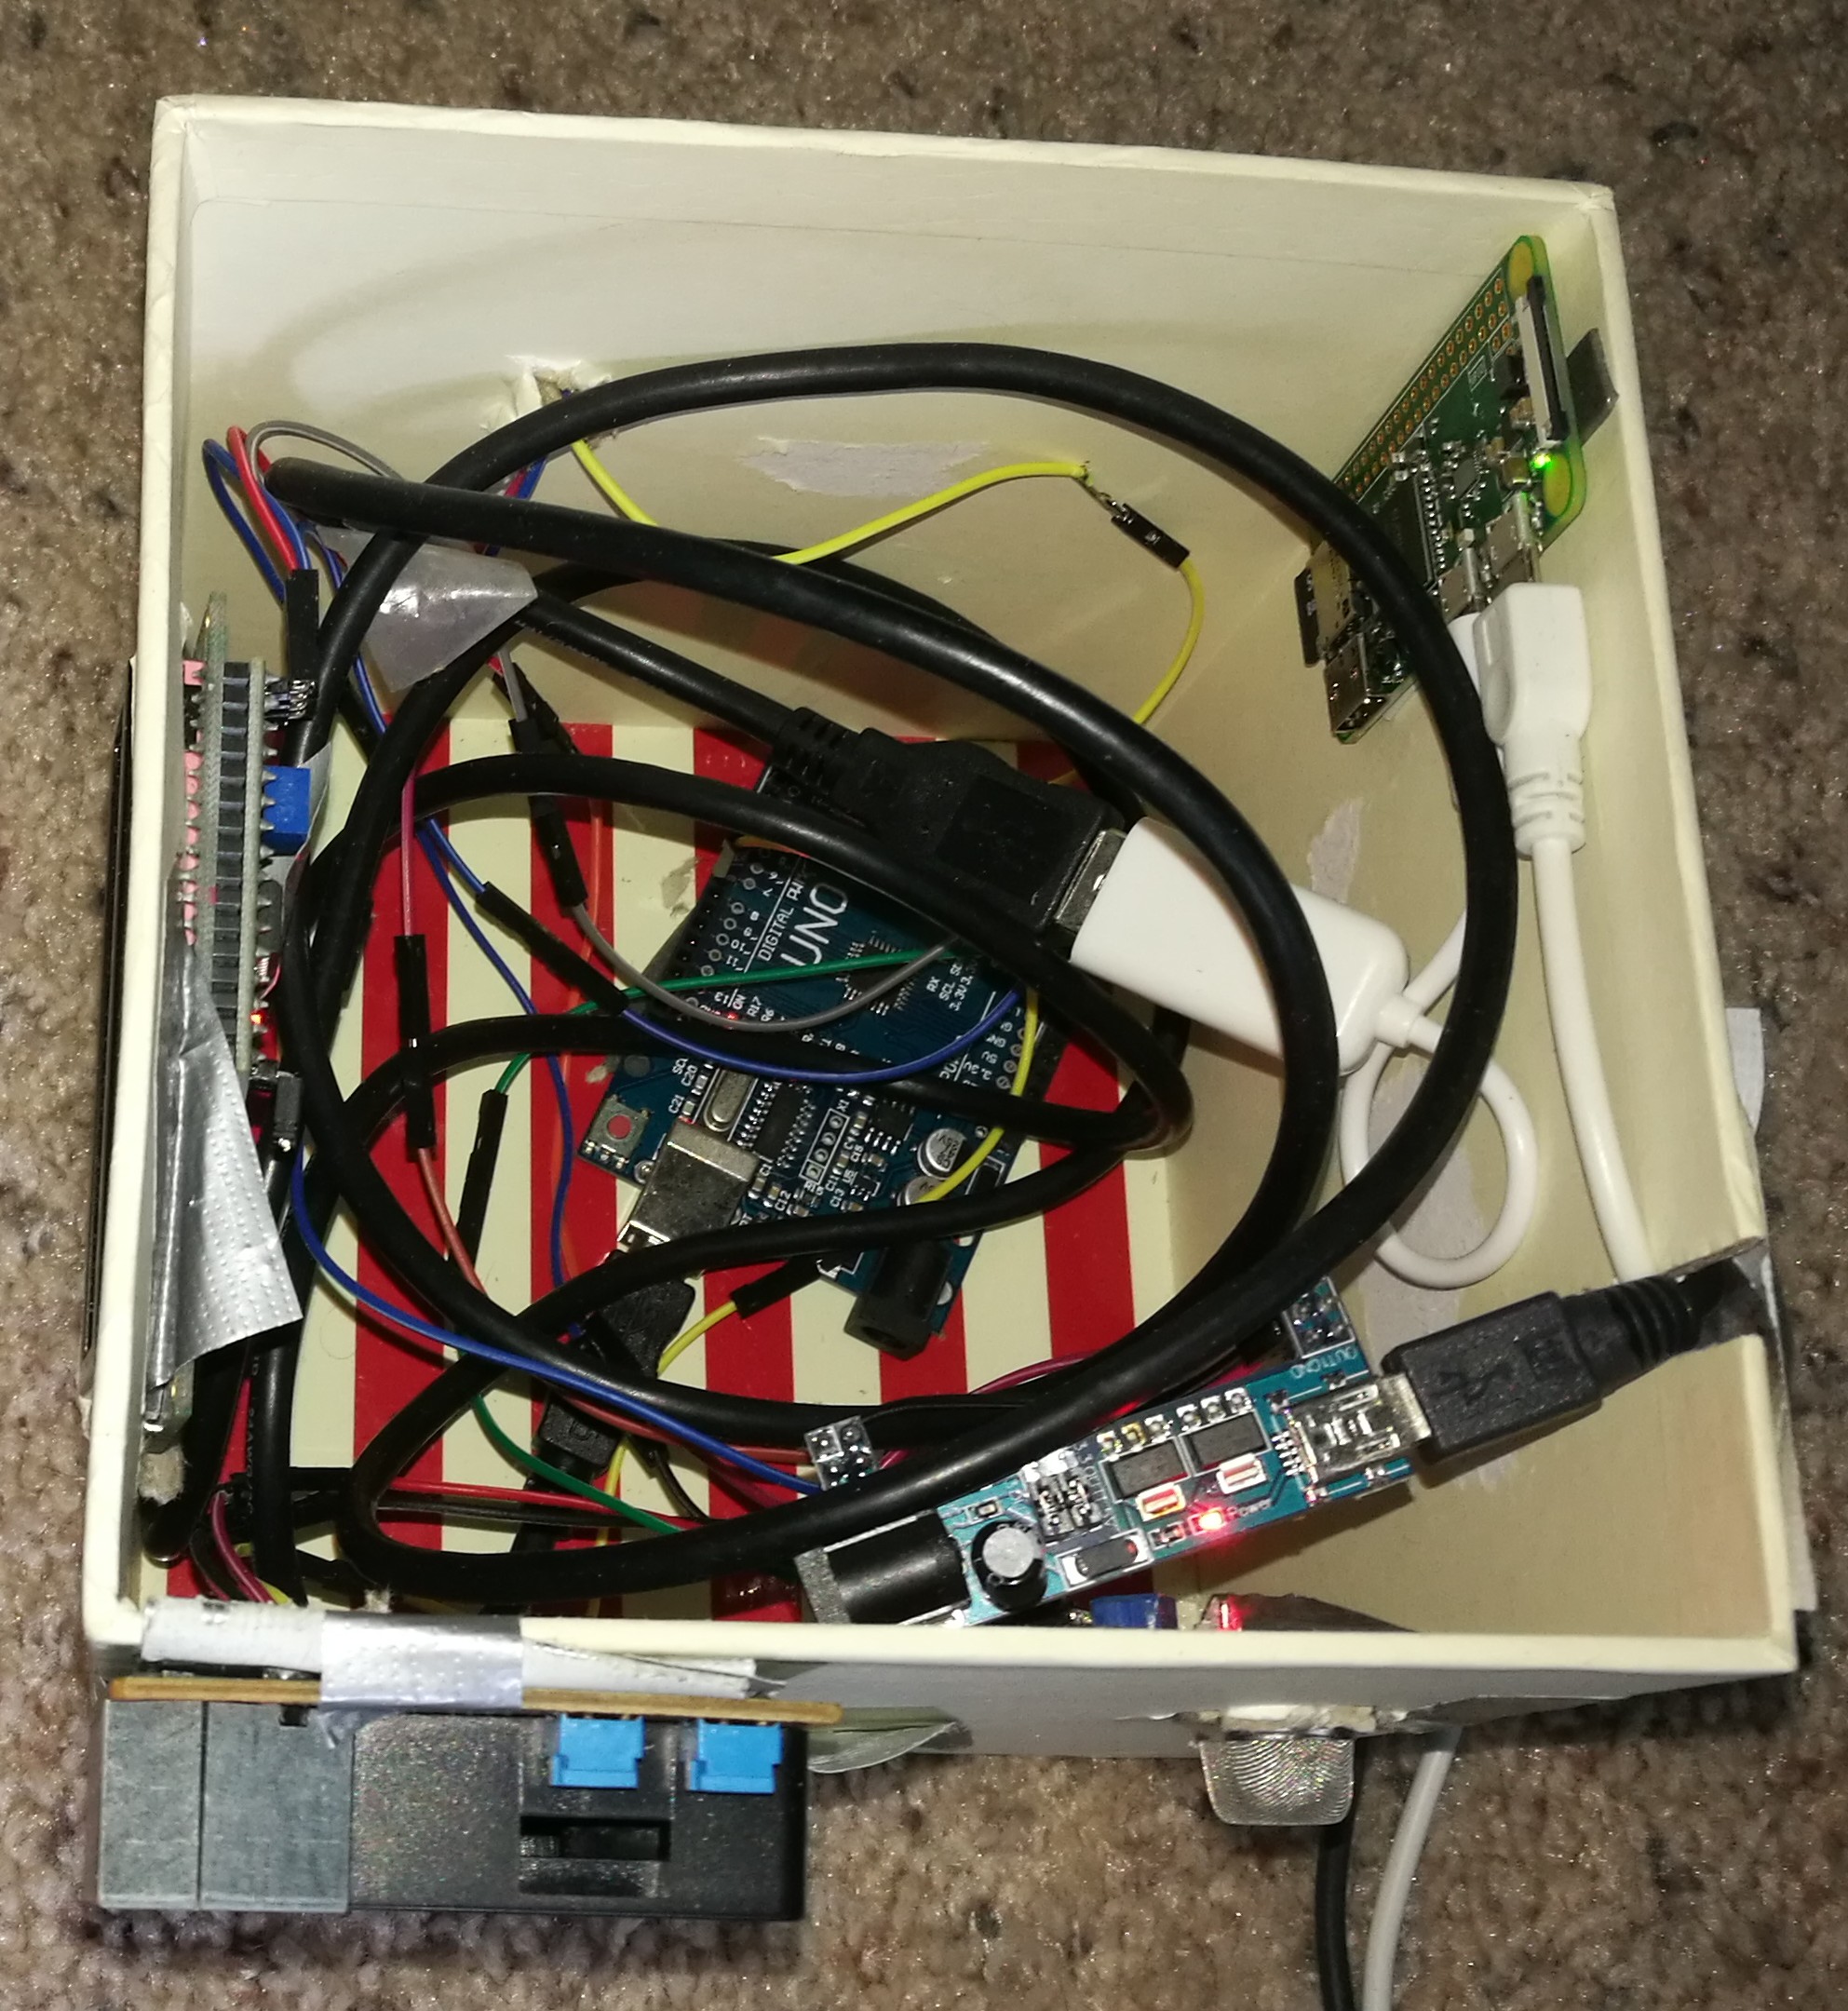
Air quality monitor hardware – II
Wiring
Power
The MB102 power module?s 2 channels are both set to 5V, powering all 4 sensors; meaning that the VCC and GND pins of the devices are wired in accordance with the sensors
- DHT22 Temperature
- MQ135 Air quality
- IIC/I2C LCD
- DHT501A Dust
Arduino side wiring
- A0 analog goes to A0 of MQ135
- A4 goes to IIC/I2C LCD’s SDA
- A5 goes to IIC/I2C LCD’s SCL
- D2, digital goes to the only one Digital out of DHT22 Temperature
- D8, digital goes to the 3rd (middle) digital pin of the DHT501A Dust
Connecting the Raspberry Pi and Arduino together ? via USB with serial protocol
- Micro USB to USB male is going to the Raspberry’s power port and to the charger
- The Raspberry powers the Arduino on its second USB port via a micro USB to USB female adapter and USB male to USB-B male (printer) cable; such case interference of Raspberry power input and MB102 adapter?s power could be avoided. This is also the connection for the Arduino to Raspberry serial communication protocol via USB, so that the Raspberry and Arduino can communicate with each other
- Mini USB male to USB male cable is going from the charger towards the MB102 power module
Sensors
DHT22 temperature & humidity sensor
A surprisingly high precision sensor. Also, super easy to use via its digital channel and library available.
A great tutorial for the DHT22 is available here – Download saved PDF from blog – http://www.instructables.com/id/How-to-use-DHT-22-sensor-Arduino-Tutorial/
MQ135 gas sensor
Returns an analog voltage based on gas concentration in the environment. It detects NH3, NOx, alcohol, Benzene, smoke and CO2.
- The higher the value, the higher the gas concentration
- Unfortunately, with home methods, it?s almost impossible to calibrate
- It needs a burn-in period (running for 2 days continuously) to stabilize measurements
- Measurements are correlating highly with temperature and humidity
I experimented a lot by using the datasheet?s curves but as the sensor has one value outputted while measuring various gases and I cannot really know when the air could be considered as clean as atmospheric air (with cca 400 PPM CO2), it is hard to translate the values. Still, spikes will show gas concentration increase. All in all, I just use the bear reading of the sensor?s analog voltage output and I?m not trying to translate it due to the above problem.
Datasheet – Download saved PDF from blog – https://www.olimex.com/Products/Components/Sensors/SNS-MQ135/resources/SNS-MQ135.pdf
MQ135 sensor readings
Note: MQ135 sensors could differ and readings could be based on the power supply as well
- Normal air returns 50-150 based on temperature and humidity (higher temp. and humid. returns higher values)
- Breath around 200
- Alcohol reads at 400
- Lighting a match underneath the sensor returns approximately 700
For further references check the following website on experimenting with the MQ135 ? and as sensors could differ, here, different measurements are presented – Download saved PDF from blog – https://olimex.wordpress.com/2015/05/26/experimenting-with-gas-sensors-and-arduino/
- The page lists the following readings
- MQ-135 normal air output 130
- Isopropyl alcohol 700
- Lighter gas 760
- Benzine 450
- Breath1 150
- Breath2 140
A longer description on the MQ135 is available here – Download saved PDF from blog – http://microcontrollerslab.com/interfacing-mq-135-gas-sensor-arduino/
DSM501A dust sensor
A cheap, photo voltaic dust sensor, seems to be working quite well.
It has a heater and an infrared emitter, the beam is facing against the sensor. The heat circulates the air within its sensor area and the reflection created by the dust, hitting the sensor is output as the value – the higher the dust, the higher the amount of light reflection and reading will be.
I added the spec sheet?s curve to Excel and got a polynomial equation on how the sensor readings can translate to ?g/m3 – although not PM2.5 or PM10 but PM detected by the sensor.
PM ?g/m3 concentration =? (2.5383 * sensorReading^2) + (85.392 * sensorReading) – 5.8319;
DSM 501A sensor readings
- Filtered air near an air purifier reads at around 30 ?g / m3
- Smoke of a match lighted under the sensor could bump it up to 1200 ?g / m3
- Nearby a major 6 lane motorway, outside, the readings have an averaging of 60 ?g / m3.
DSM501A Specification sheet – Download saved PDF from blog – http://www.samyoungsnc.com/products/3-1%20Specification%20DSM501.pdf
Alternative libraries are available at:
- https://github.com/richardhmm/DIYRepo/tree/master/arduino/libraries/DSM501
- https://github.com/empierre/arduino/blob/master/DustSensor_SamYoung_DSM501.ino
Remarks:
- A good alternative sensor would be a Shinyei PPD42NS for reference (ca. 10 USD), this page contains great insights into that particular hardware – http://www.howmuchsnow.com/arduino/airquality/grovedust/
- Also it?s worth to mention Grove, as it is s a very easy, ?non-soldering, non-wiring? plug & play platform and the Shinyei sensor is available in a Grove-compatible form as well at http://wiki.seeed.cc/Grove-Dust_Sensor/
LCM1602 LCD
LCM1602 is a backlit, 2 row * 16 character LCD module ? the backlight can be controlled by the code.
The compatibility with the LiquidCrystal_I2C library makes it quite easy to use, available at https://github.com/fdebrabander/Arduino-LiquidCrystal-I2C-library
Basically, we have to wipe and read the display in a loop and on specific conditions we can turn the backlight on or off.
Further reading on the LCD setup – Download saved PDF from blog – https://magnusglad.wordpress.com/tag/lcm1602/
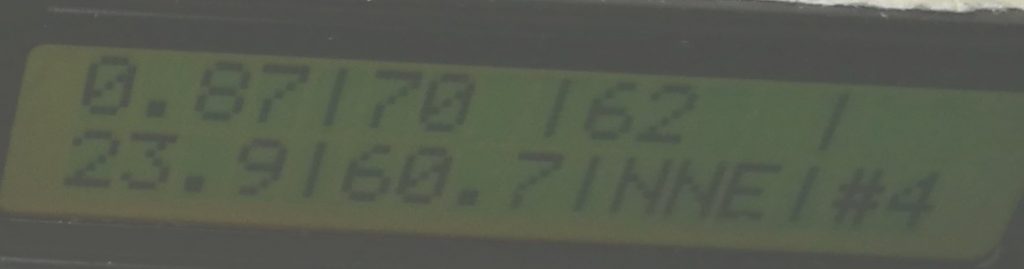
LCM1602 LCD showing on 2 lines: Line1: Dust ratio | Dist concentration | MQ135 output | Alert (if any) Line2: Temperature in C | Humidity % | Wind direction | Ait quality grade (1-5, 5 is the best)
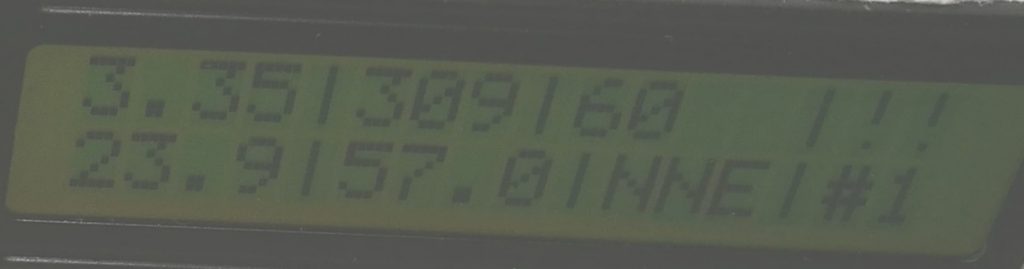
LCM1602 LCD showing air quality data (described above)
Raspberry code & data persistence
The Rasbperry Pi Zero W is a 10 $ ARM compatible computer running Linux (Raspbian distro in my case) from a MicroSD card. It has 2 USB slots, built-in Wifi capable of being a host and a guest at the same time, Bluetooth, HDMI, and many digital ports that I considered not to use because of the limited voltage options that Raspberry provides ? Arduino is much more flexible from this perspective. Now, with lot more hardware and circuit planning, building, soldering, this project could have been done only with the Raspberry, but I chose the plug and play components in order to leverage the pros of both platforms, sparing lots and lots of development time.
How to set up the RaspberryPi without a keyboard and a monitor? Headless setup
- First I installed and then configured Raspbian OS from the SD card
- I used headless setup, so the Raspberry would connect to my Wireless and I could log in via SSH without having all complicated micro-USB and mini-HDMI adapters hooked on for the keyboard, monitor, etc. connectivity
- Raspbian Install – Download saved PDF from blog – https://www.raspberrypi.org/documentation/installation/installing-images/
- Headless setup – Download saved PDF from blog – https://raspberrypi.stackexchange.com/questions/10251/prepare-sd-card-for-wifi-on-headless-pi
How can the RaspberryPi communicate via an Arduino? Serial connection over USB
I’ve used this guide on setting up the RaspberryPi USB to Arduino serial via USB connection – Download saved PDF from blog -? https://oscarliang.com/connect-raspberry-pi-and-arduino-usb-cable/
How to start processes on the RaspberryPi automatically? Via Raspbian’s rc.local
The script starts from /etc/rc.local on the boot-up of the RaspberryPi Zero W
#!/bin/sh -e
#
# rc.local
/usr/bin/python /air/air.py & > /air/output.log
Described in – Download saved PDF from blog? – https://www.raspberrypi.org/documentation/linux/usage/rc-local.md
How to configure the Raspberry Pi to be a Wifi host and a guest at the same time? Via Raspbian’s network settings
The purpose is that when there is a known network for the Raspberry, it would connect to it, so SSH to host raspberrypi.local or router DHCP-based IP of the Raspberry would be possible. Also it would download weather information from the internet and share to its database file with every reading of the Arduino.
The purpose of the host network is the headless setup possibility, so without a keyboard, mouse, monitor hooked to the non-conventional ports of the Raspberry, SSH based configuration is made possible
The following guide was used on the configuration – Download saved PDF from blog – http://imti.co/post/145442415333/raspberry-pi-3-wifi-station-ap
How to get IP based location data with Python? (On the Raspberry’s side)
The IP API at?http://ip-api.com/docs/api:json responds with the geographical location based on an IP address.
The code snippet in Python is very compact to get hold off our latitude and longitude.
response = urlopen('http://ip-api.com/json') # Get latitude and longitude from IP-API
data = json.load(response)
lat = data['lat']
lon = data['lon']
How to get weather, including wind data with Python? (On the Raspberry’s side)
The Openweathermap API at http://api.openweathermap.org can respond with detailed weather data based on a latitude and longitude (see automation based on IP above).
The code snippet in Python is very compact to acquire detailed weather data.
response = urlopen('http://api.openweathermap.org/data/2.5/weather?lat='+str(lat)+'&lon='+str(lon)+'&appid={YOURAPIKEY}') # Get latitude and longitude based wind data
data = json.load(response)
windDeg = data.get('wind').get('deg')
windSpeed = data.get('wind').get('speed')
Next steps
There are a lot of improvement opportunities, e.g.
- Uploading the data to a RaspberryPi-based PostgreSQL database
- Uploading and processing the data with AWS IOT?s platform and continuously analyzing it with AWS Quicksights
- CGI-based UI for RaspberryPi on setting up various Wifi connections
Measurements
- 5 days of outside air measurements taken 200 meters from a major highway showed the following:
- PM concentrations increased by 15% during traffic rush hours
- Although studies state that wind direction is the most important factor in PM concentration from highways, there was no correlation between wind direction and PM concentrations
- MQ135 had no spikes based on rush hours – most likely it is not sensitive enough, measurements are rather dependent on temperature and humidity
- Inside measurements show that simple HEPA filters within an apartment filter dust quite effectively, inside dust concentrations are 30% of that of the outside with filtering
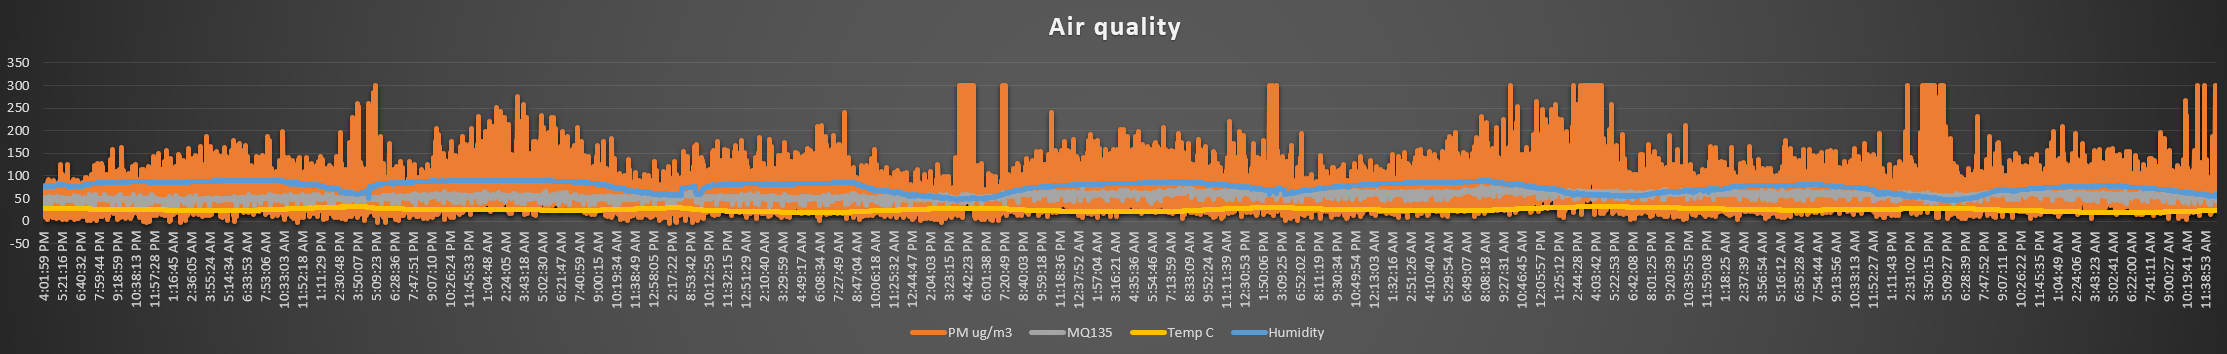
Air quality measurements – diagramming PM ug/m3, MQ135, Temperature and Humidity
Code
Arduino ? acquiring air quality data from DSM501A dust, MQ135 gas and DHT22 Temperature and humidity sensor, outputting to LCM1602 LCD and serial
Using the Arduino IDE
#include <Wire.h>
#include <SimpleDHT.h> //Humidity & Temp
#include <LCD.h> //LCD
#include <LiquidCrystal_I2C.h> //LCD

/* LCD */
    LiquidCrystal_I2C lcd(0x27, 2, 1, 0, 4, 5, 6, 7, 3, POSITIVE); // Addr, En, Rw, Rs, d4, d5, d6, d7, backlighpin, polarity

/* Dust - Samyoung DSM501A*/
    int dustpin = 8; // data from dust sensor
    unsigned long duration;
    unsigned long starttime;
    unsigned long sampletime_ms = 30000;  // Set sample time in milliseconds. Leave this at 30,000 (30sec) for the dust sendor to work accurately
    unsigned long lowpulseoccupancy = 0;
    float ratio = 0;
    float concentration = 0;

/* Temperature + humidity monitor - DHT22 */
    int pinDHT22 = 2;
    SimpleDHT22 dht22;
    int err = SimpleDHTErrSuccess;
    float temperature = 0;
    float humidity = 0;
    int qIndex = 0;

/* Gas sensor - MQ135  */
    int sensorValue;

    /*
     * Regarding raw values
     *  Clean air = 100 +- 50
        Alcohol =  400
        Gas = 600
    */

/* Reading data from serial */
String wind = "";         // a String to hold incoming data
boolean stringComplete = false;  // whether the string is complete

void setup()
{
/* LCD */
      lcd.begin(16,2);

/* Dust */
      Serial.begin(9600);
      pinMode(8,INPUT); // set pin 8 to input to read data from dust sensor
      pinMode(A0,INPUT); // set pin 8 to input to read data from dust sensor
      starttime = millis();//get the current time;
      lcd.setBacklight(LOW);        // Backlight off
      //lcd.setBacklight(HIGH);        // Backlight on

/* Data structure on serial output for RaspberryPi */
      Serial.print("Start_Time;PM_Ratio;PM_Concentration;MQ_Raw;Temperature;Humidity");
      Serial.println();

}

void loop() {

    duration = pulseIn(dustpin, LOW); //Checks photovoltaic duration
    lowpulseoccupancy = lowpulseoccupancy + duration; //adds duration to our measure
    if ((millis()-starttime) >= sampletime_ms) //if at sampletime_ms, plot the data
    {
      wipeLines(); //del LCD

      /* PM10 values */
      ratio = lowpulseoccupancy/(sampletime_ms*10.0);  // Percentage, values: 0 - 100
      concentration =  (2.5383 * pow(ratio, 2)) + (85.392 * ratio) - 5.8319; // Equations based on Samyoung DSM501A spec sheet -
      if(concentration > 9999) { // For LCD, don't plot values more than 999
        concentration = 9999;
      }

      /* DHT values */
      int err = SimpleDHTErrSuccess;
      if ((err = dht22.read2(pinDHT22, &temperature, &humidity, NULL)) != SimpleDHTErrSuccess) {
        Serial.print("Read DHT22 failed, err="); Serial.println(err);delay(2000);
        return;
      }

      /* Mq135 Gas value */
      sensorValue = analogRead(A0);

      /* Calculate an air quality index for the LCD based on PM10 values*/
      if (ratio<0.75)
        qIndex = 5;
      else if (ratio>0.75 && ratio<1)
        qIndex = 4;
      else if (ratio>1 && ratio<1.25)
        qIndex = 3;
      else if (ratio>1.25 && ratio<1.5)
        qIndex = 2;
      else if (ratio>1.5)
        qIndex = 1;

      /* Print data to serial = Raspberry */
      Serial.print(starttime/1000/60); //start of experiment - in minutes
      Serial.print(";");
      Serial.print(ratio); //PM10 ratio read
      Serial.print(";");
      Serial.print(concentration); //PM10 mg/m2
      Serial.print(";");
      Serial.print(sensorValue ); //Raw sensor value for MQ135
      Serial.print(";");
      Serial.print(temperature); //Temperature in Celsius
      Serial.print(";");
      Serial.print(humidity); //Relative Humidity%
      Serial.println();

      /* Print to LCD */
      //Line1: PM10 ration | PM10 concentration in mg/m3 | PPM of MQ135 | QualityIndex Alert !!
      lcd.clear();              // clear display, set cursor position to zero
      lcd.setCursor (0,0);      // col 0 of line 1
      lcd.print(ratio);
      lcd.setCursor(4,0);
      lcd.print("|");
      lcd.setCursor(5,0);
      lcd.print((int)concentration);
      lcd.setCursor(9,0);
      lcd.print("|");
      lcd.setCursor(10,0);
      lcd.print(sensorValue);
      lcd.setCursor(13,0);
      lcd.print("|");
      lcd.setCursor(14,0);
      if (qIndex>=1 && qIndex <= 3)
        lcd.print("!!");

      //Line2: Temperature in C | Humidity% | Wind direction from Raspberry | QualityIndex
      lcd.setCursor(0,1);       // col 1 of line 2
      lcd.print(temperature);
      lcd.setCursor(4,1);
      lcd.print("|");
      lcd.setCursor(5,1);
      lcd.print(humidity);
      lcd.setCursor(9,1);
      lcd.print("|");
      lcd.setCursor(10,1);
      lcd.print(wind);
      lcd.setCursor(13,1);
      lcd.print("|");
      lcd.setCursor(14,1);
      lcd.print("#");
      lcd.setCursor(15,1);
      lcd.print(qIndex);


      if (stringComplete) { //If $ sign appeared from Raspberry, reset  and stringComplete
        wind = "";
        stringComplete = false;
      }
      lowpulseoccupancy = 0;  // Reset lowpulse occupancy for next measurement
      starttime = millis();   // Get starttime
    }
}

/* Reset the LCD */
void wipeLines() {
  for (int y = 0; y < 2; y++) {
    for (int x = 0; x < 20; x++) {
      lcd.setCursor (x,y);
      lcd.print(" ");
    }
  }
}

/* Listen to the string on wind direction from RaspberryPi */
void serialEvent() {
  while (Serial.available()) {
    // get the new byte:
    char inChar = (char)Serial.read();
    // add it to the wind:
     wind += inChar;
    // if the incoming character is a newline, set a flag so the main loop can react
    if (inChar == '
Raspberry ? getting location and weather data, reading serial sensor data from Arduino, writing wind data for Arduino
Using Python 2.7 with Pip
import time
import serial
ser = serial.Serial('/dev/serial/by-id/usb-1a86_USB2.0-Serial-if00-port0', 9600) #get the Arduino port by lsusb in Bash
import urllib2
from urllib2 import Request, urlopen, URLError
import json

def internet_on(): # Check if there is an internet connection
    try:
        urllib2.urlopen('https://www.google.com', timeout=1)
        return True
    except urllib2.URLError as err:
        return False

def degToCompass(num): # Convert the wind degrees to compass directions (where the wind is blowing from)
    try:
        val=int((num/22.5)+.5)
        arr=["N  ","NNE","NE ","ENE","E  ","ESE", "SE ", "SSE","S  ","SSW","SW ","WSW","W  ","WNW","NW ","NNW"]
        return arr[(val % 16)]
    except:
        print('API')
        return('API')

def writeWind(): # Get wind data
        if internet_on():
                try:
                        global windDeg
                        global windSpeed
                        response = urlopen('http://ip-api.com/json') # Get latitude and longitude from IP-API
                        data = json.load(response)
                        lat = data['lat']
                        lon = data['lon']
                        response = urlopen('http://api.openweathermap.org/data/2.5/weather?lat='+str(lat)+'&lon='+str(lon)+'&appid={YOURAPIKEY}') # Get latitude and longitude based wind data
                        data = json.load(response)
                        windDeg = data.get('wind').get('deg')
                        windSpeed = data.get('wind').get('speed')
                        ser.write(degToCompass(windDeg))
                except:
                        print('API')
                        ser.write('API')
        else:
                print('NET')
                ser.write('NET')


windDeg = 0
windSpeed = 0
count = 0
string = 'DD/MM/YYYY;HH:MM:SS;WindDeg;WindSpeed;Start_Time;PM_Ratio;PM_Concentration;MQ_Raw;Temperature;Humidity
'
writeWind()
while 1 : #Read
        else:
            goodWind = 0
        string += time.strftime("%d/%m/%Y;%H:%M:%S") + ';' + degToCompass(windDeg) + ';' + str(windSpeed) + ';' # Add data from the Python side
        string += ser.readline() # Read a complete (/n separated) line from the Arduino, waits here, while the line arrives (every 30 seconds from the Arduino)
        count+=1
        if (count == 9):
                ser.write('
Further references / alternatives
I hereby list the most valuable pages I came across in terms of alternative platforms or helping understand data readings of the sensors.
- Grove sensor-based projects
- Grove I – Air quality sensor with the easy wiring Grove platform and sensors – http://www.instructables.com/id/Room-Air-Analyzer/
- Grove II – Air quality sensor with the easy wiring Grove platform and sensors ? http://www.instructables.com/id/Air-Quality-Test-Box/
- Grove III – Air quality sensor with the easy wiring Grove platform and sensors ? http://lelabtechno.com/analyseur%20air.html
- Other projects
- Speck, networked air quality monitor, using the DMS501A dust sensor – https://www.specksensor.com/support/tech-specs
- Shinyei PPD42NS dust sensor
- Tweaking the sensitivity of an alternative, Shinyei PPD42NS dust sensor and connecting it to the network via a Raspberry Pi – https://indiaairquality.com/2014/12/14/building-pickle-jr-the-low-cost-networked-pm2-5-monitor-part-2/
- Dust readings of an alternative, Shinyei PPD42NS dust sensor – http://irq5.io/2013/07/24/testing-the-shinyei-ppd42ns/
- Air quality background information
- AQI / Air quality index – https://en.wikipedia.org/wiki/Air_quality_index
- Background on Particle Pollution Designations GuidanceParticle Pollution Designations -? https://www.epa.gov/particle-pollution-designations/particle-pollution-designations-guidance-and-data
- Understanding dust sensor outputs – https://forum.mysensors.org/topic/291/dust-sensor-1-4/16
- Dylos, a professional dust sensor manufacturer describes how to calculate PM concentration – http://billpentz.com/woodworking/cyclone/dylos.cfm
- PM10 trends of the US – https://www.epa.gov/air-trends/particulate-matter-pm10-trends
- Gas sensors
- MQ135 readings – http://davidegironi.blogspot.it/2014/01/cheap-co2-meter-using-mq135-sensor-with.html
- A detailed list of gas sensors available here: https://playground.arduino.cc/Main/MQGasSensors
- An Arduino library for the MQ135 – not to used in this project – is available here? – https://hackaday.io/project/3475-sniffing-trinket/log/12363-mq135-arduino-library